Pattison Chronicle Headquarters SEATTLE, WA. With the
political season quickly approaching, we are all about to be bombarded by
infographics. Candidates will want to express their plans for the U.S. in a
colorful format that really says nothing, but makes readers feel like they
might have learned something. In celebration of this hellish political race
that we’re already pissed about, here’s a guide to how you can create your own
info graphics!
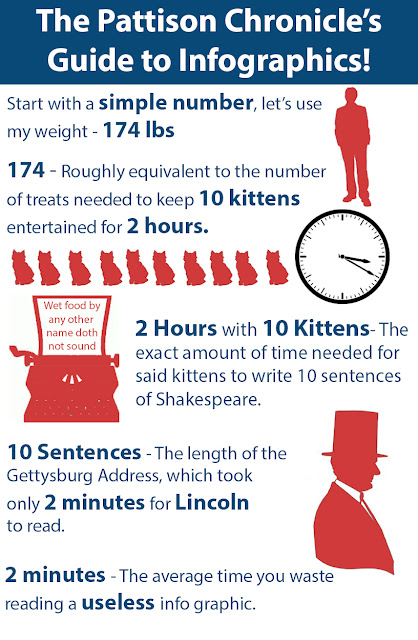
Step 1. Pick a number. It can be any number really, but all good info graphics start with an arbitrary number. Be sure to bold all numbers and words you like in your graphic.
Step 2. Pick two colors, one for text, and one for graphics. These colors should be primary colors, but in a dimmer tone to make the graphic look professional.
Step 3. Relate the initial number to another arbitrary concept that shares some common characteristic and add silhouetted graphics for emphasis.
Step 4. Repeat Step 3 two to five more times.
Step 5. End with a call to action, or a fact that ties it all together.
Well done! You’ve just created an info graphic! Share it
with us, share it with your friends, and send it to your mother to show her how
smart you are. We will re-post the best info graphics on our many pages, so
submit you sheeple!


No comments:
Post a Comment